What’s the climate like in Vorarlberg?
The current climate in Vorarlberg features temperatures ranging from a high of 26°C to a low of 5°C throughout the year. The average yearly temperature is around 16°C. At night, temperatures in the colder months average around -1°C and in the warmer months around 16°C.
The highest temperature recorded in Vorarlberg in recent years was 36°C in July 2023. The lowest daytime temperature recorded was -7°C in February 2018.
On average, Vorarlberg gets 1734 mm of precipitation each year. Of this, about 112 cm is snowfall. For comparison, New York gets 1142 mm of precipitation each year.
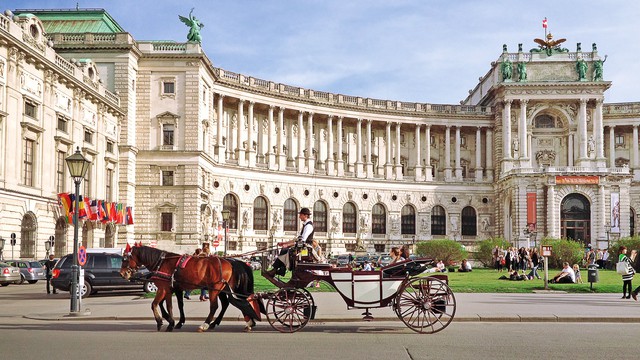
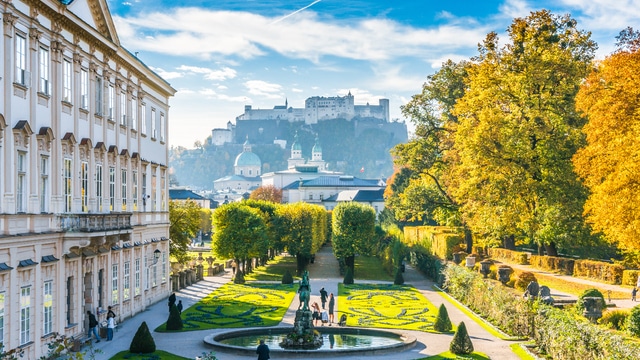
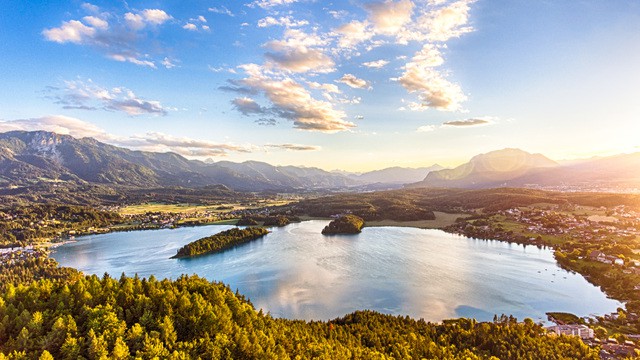
Curious about the weather in other parts of Austria? Check out the climate and weather for spots like Tyrol, Vienna, Salzburg, or explore other destinations in Austria.
Best time to visit Vorarlberg?
The best time to visit Vorarlberg for mild to warm weather is April up to October. You might get some rain, but the temperatures are just right to explore Vorarlberg.
Climate Table of Vorarlberg
The climate table of Vorarlberg shows the average temperatures, rainfall, snow, and UV index per month. The table provides an overview of the average day and night temperatures in degrees Celsius, the total amount of rainfall in millimeters, the total snowfall in centimeters, and the UV index for each month. Rainfall is always measured as water, even if it's snow or hail.
| Jan | Feb | Mar | Apr | May | Jun | Jul | Aug | Sep | Oct | Nov | Dec | |
|---|---|---|---|---|---|---|---|---|---|---|---|---|
| Temp. max (°C) | 5 | 7 | 10 | 16 | 19 | 24 | 26 | 25 | 21 | 16 | 10 | 6 |
| Temp. min (°C) | -1 | 0 | 1 | 6 | 10 | 14 | 16 | 15 | 12 | 8 | 4 | 1 |
| Precipitation | ||||||||||||
| Precipitation (mm) | 134 | 96 | 83 | 115 | 207 | 170 | 194 | 252 | 140 | 113 | 103 | 127 |
| Snow (cm) | 38 | 17 | 21 | 5,4 | 0,3 | 0 | 0 | 0 | 0 | 0,3 | 7,5 | 23 |
| UV Index | 2 | 4 | 5 | 6 | 7 | 7 | 7 | 6 | 5 | 4 | 2 | 2 |
Click on the month name to see more weather details, like daily averages, temperatures, and precipitation for the past years in that month.
- Average yearly temperature: 16°C
- Highest temperature: 26°C in July
- Lowest temperature: 5°C in January
- Precipitation*: 1734 mm per year, averaging 145 mm per month
- Snowfall: 112 cm per year
- Driest months: 83 mm in March, 96 mm in February and 103 mm in November
- Wettest months: 252 mm in August, 207 mm in May and 194 mm in July
*Precipitation is measured as a combination of rain, snow, and hail
Weather experiences in Vorarlberg
Excellent![]()
![]()
![]()
![]()
![]()
We have been going to camping in the Voralgebirge every year... more
Average Temperature per Month in Vorarlberg
This graph shows the average maximum temperatures per month in Vorarlberg, Austria. The temperatures are shown in degrees Celsius and the average is calculated based on the recorded temperatures per month from past years.
Average Precipitation per Month in Vorarlberg
This graph shows how much rainfall Vorarlberg, Austria, gets on average per month. Rainfall is always measured as water, even if it's snow or hail. This makes it easy to compare how much has fallen, regardless of the form of precipitation. The amount of rainfall is measured in millimeters, and the average is calculated based on the recorded rainfall per month from past years.
Average Snowfall per Month in Vorarlberg
This graph shows how much snow Vorarlberg, Austria, gets on average per month. The amount of snowfall is measured in centimeters and the average is calculated based on the recorded snowfall per month from past years.
Average UV Index per Month in Vorarlberg
This graph shows the average UV index per month in Vorarlberg, Austria. The UV index indicates the intensity of ultraviolet radiation and ranges from 0 to a maximum of 11.
Yearly Temperature in Vorarlberg
This graph shows the average yearly temperature in Vorarlberg, Austria. The yearly temperature, expressed in degrees Celsius, is the average of all twelve monthly temperatures summed up for that year.
Total Yearly Precipitation in Vorarlberg
This chart shows the total yearly precipitation in Vorarlberg, Austria, over the past few years. The total yearly precipitation, measured in millimeters, is the sum of all the rain that fell in the twelve months of that year.
Total Yearly Snowfall in Vorarlberg
This chart shows the total yearly snowfall in Vorarlberg, Austria, over the past few years. The total yearly snowfall, measured in centimeters, is the sum of all the snow that fell in the twelve months of that year.
Weather experiences in Vorarlberg
The weather in Vorarlberg is rated 5 out of 5 stars by 1 visitor.
Write your own reviewWe have been going to camping in the Voralgebirge every year since 2010. We always have temperatures between 22 and 34 degrees, lots of sun, little rain. Many Dutch people camp here for (decades)years in a row. If the weather would be bad they would not come back so often. So do we. I was also surprised at the nice weather there in June, but it really is. The occasional day of rain can happen. But out of the 21 days we stayed there we had 3 rainy days once (spread out).— This text is automatically translated to English
Have you been to Vorarlberg?
Share your weather experiences in Vorarlberg.
Average weather in Vorarlberg by month
Click on a month below to see detailed weather info for Vorarlberg. Based on historical weather data, you can see the average temperature, precipitation, wind, and UV index for each day of the month.
Popular destinations in Austria
Discover the climate of these popular destinations in Austria.