What’s the climate like in London?
The current climate in London features temperatures ranging from a high of 27°C to a low of -3°C throughout the year. The average yearly temperature is around 14°C. At night, temperatures in the colder months average around -12°C and in the warmer months around 16°C.
The highest temperature recorded in London in recent years was 34°C in July 2020. The lowest daytime temperature recorded was -19°C in February 2015.
On average, London gets 1141 mm of precipitation each year. Of this, about 136 cm is snowfall. For comparison, New York gets 1142 mm of precipitation each year.
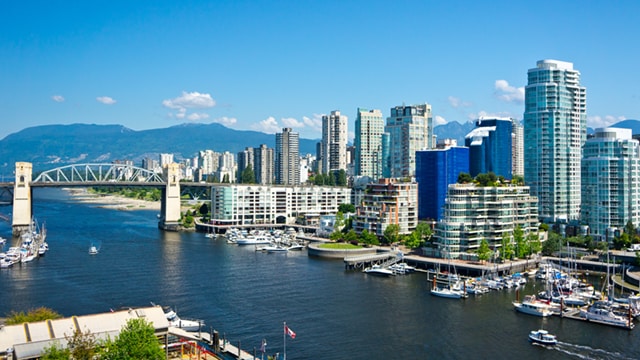
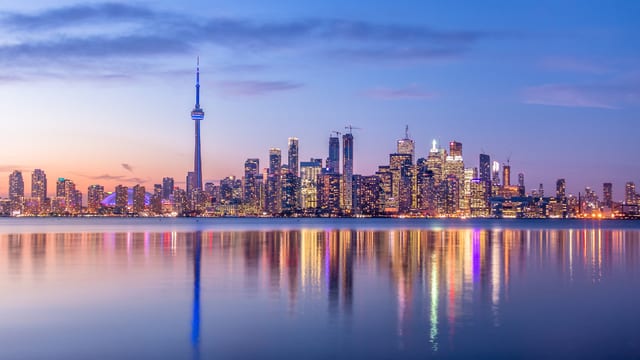
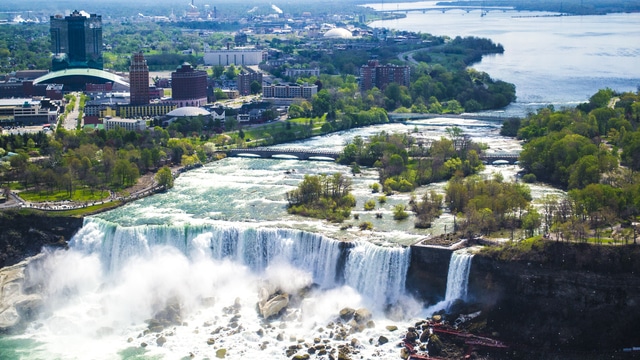
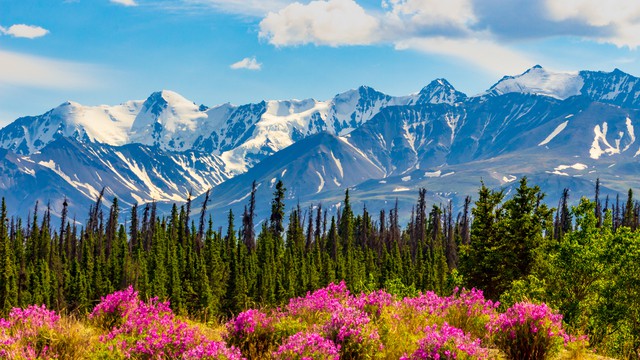
Curious about the weather in other parts of Canada? Check out the climate and weather for spots like Vancouver, Toronto, Niagara Falls, or explore other destinations in Canada.
Best time to visit London?
The best time to visit London for sunny weather is May, June, August and September. During this period, you'll have nice temperatures and not too much rain, making it a great time to visit London. In the other months of the year, there's too much rain or the temperature isn't ideal for a visit if you want sunny and pleasant weather.
Climate Table of London
The climate table of London shows the average temperatures, rainfall, snow, and UV index per month. The table provides an overview of the average day and night temperatures in degrees Celsius, the total amount of rainfall in millimeters, the total snowfall in centimeters, and the UV index for each month. Rainfall is always measured as water, even if it's snow or hail.
| Jan | Feb | Mar | Apr | May | Jun | Jul | Aug | Sep | Oct | Nov | Dec | |
|---|---|---|---|---|---|---|---|---|---|---|---|---|
| Temp. max (°C) | -1 | -3 | 5 | 12 | 20 | 25 | 27 | 26 | 23 | 16 | 8 | 3 |
| Temp. min (°C) | -8 | -11 | -4 | 2 | 9 | 14 | 16 | 16 | 13 | 7 | 0 | -3 |
| Precipitation | ||||||||||||
| Precipitation (mm) | 83 | 137 | 84 | 88 | 67 | 87 | 138 | 97 | 77 | 88 | 129 | 66 |
| Snow (cm) | 29 | 54 | 12 | 3,5 | 0,1 | 0 | 0 | 0 | 0 | 0,5 | 17 | 19 |
| UV Index | 3 | 4 | 5 | 6 | 7 | 7 | 7 | 7 | 6 | 4 | 3 | 2 |
Click on the month name to see more weather details, like daily averages, temperatures, and precipitation for the past years in that month.
- Average yearly temperature: 14°C
- Highest temperature: 27°C in July
- Lowest temperature: -3°C in February
- Precipitation*: 1141 mm per year, averaging 95 mm per month
- Snowfall: 136 cm per year
- Driest months: 66 mm in December, 67 mm in May and 77 mm in September
- Wettest months: 138 mm in July, 137 mm in February and 129 mm in November
*Precipitation is measured as a combination of rain, snow, and hail
Weather experiences in London
Average Temperature per Month in London
This graph shows the average maximum temperatures per month in London, Canada. The temperatures are shown in degrees Celsius and the average is calculated based on the recorded temperatures per month from past years.
Average Precipitation per Month in London
This graph shows how much rainfall London, Canada, gets on average per month. Rainfall is always measured as water, even if it's snow or hail. This makes it easy to compare how much has fallen, regardless of the form of precipitation. The amount of rainfall is measured in millimeters, and the average is calculated based on the recorded rainfall per month from past years.
Average Snowfall per Month in London
This graph shows how much snow London, Canada, gets on average per month. The amount of snowfall is measured in centimeters and the average is calculated based on the recorded snowfall per month from past years.
Average UV Index per Month in London
This graph shows the average UV index per month in London, Canada. The UV index indicates the intensity of ultraviolet radiation and ranges from 0 to a maximum of 11.
Yearly Temperature in London
This graph shows the average yearly temperature in London, Canada. The yearly temperature, expressed in degrees Celsius, is the average of all twelve monthly temperatures summed up for that year.
Total Yearly Precipitation in London
This chart shows the total yearly precipitation in London, Canada, over the past few years. The total yearly precipitation, measured in millimeters, is the sum of all the rain that fell in the twelve months of that year.
Total Yearly Snowfall in London
This chart shows the total yearly snowfall in London, Canada, over the past few years. The total yearly snowfall, measured in centimeters, is the sum of all the snow that fell in the twelve months of that year.
Weather experiences in London
The weather in London is rated an average of 2,7 out of 5 stars by 6 visitors. Have you been to London? Share your weather experience to help other visitors.
Write your own reviewIt is very cold and dark. When it is not snowing, it can be completely gray. A thick winter coat and boots are required.— This text is automatically translated to English
You realize that winter is approaching and snow may fall. Low temperatures make it difficult to fully enjoy your vacation. Be sure to wear warm clothing!— This text is automatically translated to English
On hot days, a little rain brings a welcome change. In short, a good summer spot.— This text is automatically translated to English
Temperatures ranged from quite warm to quite cold. Unpredictable rain showers destroyed outdoor plans at times. Bring layers of clothing and an umbrella!— This text is automatically translated to English
Although this offers majestic views, outdoor activities are made difficult. Be sure to bring warm clothing!— This text is automatically translated to English
A few sunny days were followed by rain and snow. Temperatures fluctuated widely, rising to 10 degrees Celsius, but often dropped below freezing. Partly due to strong winds, it often got colder.— This text is automatically translated to English
Have you been to London?
Share your weather experiences in London.
Average weather in London by month
Click on a month below to see detailed weather info for London. Based on historical weather data, you can see the average temperature, precipitation, wind, and UV index for each day of the month.
Popular destinations in Canada
Discover the climate of these popular destinations in Canada.