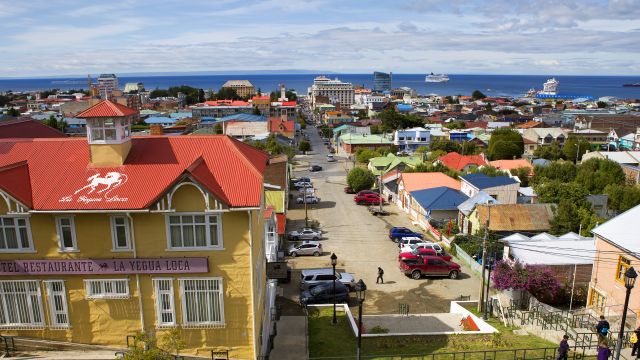
What’s the climate like in Punta Arenas?
The current climate in Punta Arenas features temperatures ranging from a high of 14°C to a low of 5°C throughout the year. The average yearly temperature is around 10°C. At night, temperatures in the colder months average around 0°C and in the warmer months around 6°C.
The highest temperature recorded in Punta Arenas in recent years was 28°C in February 2019. The lowest daytime temperature recorded was -6°C in May 2023.
On average, Punta Arenas gets 277 mm of precipitation each year. Of this, about 31 cm is snowfall. For comparison, New York gets 1142 mm of precipitation each year.
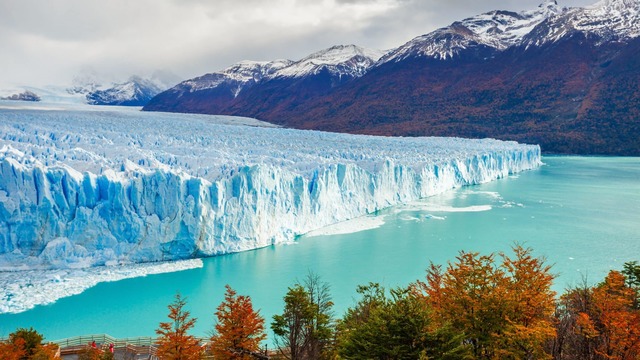
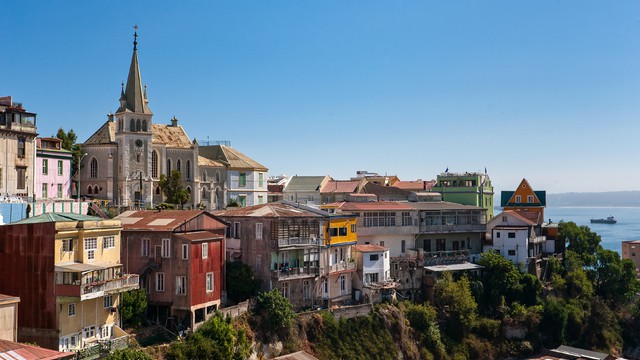
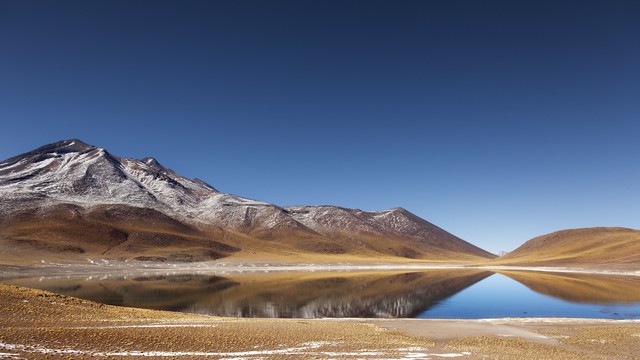
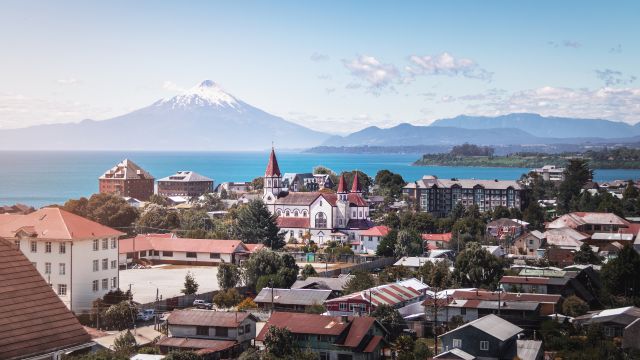
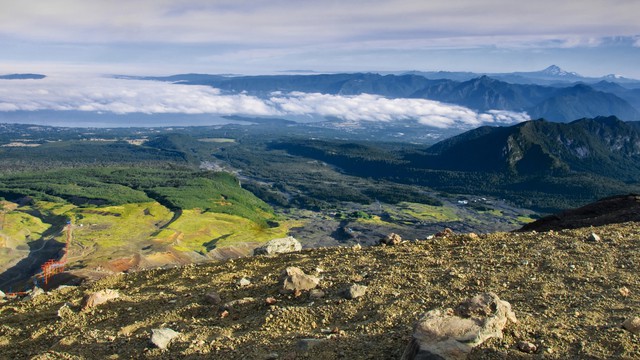
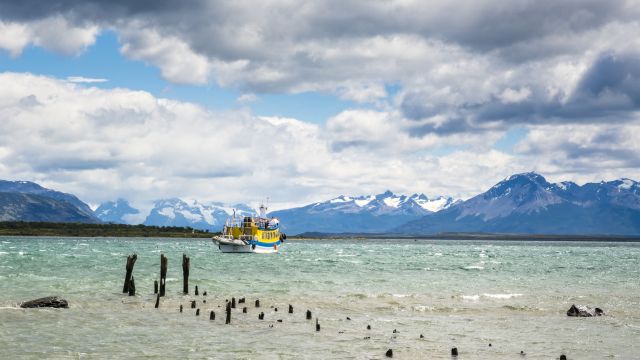
Curious about the weather in other parts of Chile? Check out the climate and weather for spots like Santiago, Patagonia, Valparaíso, or explore other destinations in Chile.
Best time to visit Punta Arenas?
If you're after warm and sunny weather, there aren’t really any specific months that are best to visit Punta Arenas. The temperatures are too low throughout the year, or there’s just too much precipitation.
Climate Table of Punta Arenas
The climate table of Punta Arenas shows the average temperatures, rainfall, snow, and UV index per month. The table provides an overview of the average day and night temperatures in degrees Celsius, the total amount of rainfall in millimeters, the total snowfall in centimeters, and the UV index for each month. Rainfall is always measured as water, even if it's snow or hail.
| Jan | Feb | Mar | Apr | May | Jun | Jul | Aug | Sep | Oct | Nov | Dec | |
|---|---|---|---|---|---|---|---|---|---|---|---|---|
| Temp. max (°C) | 14 | 14 | 12 | 9 | 7 | 6 | 5 | 7 | 9 | 9 | 12 | 12 |
| Temp. min (°C) | 7 | 7 | 5 | 3 | 2 | 1 | 0 | 1 | 3 | 3 | 5 | 6 |
| Precipitation | ||||||||||||
| Precipitation (mm) | 19 | 22 | 28 | 33 | 29 | 28 | 26 | 22 | 13 | 19 | 19 | 19 |
| Snow (cm) | 0 | 0 | 0,1 | 1,7 | 1,5 | 7,4 | 11 | 5,7 | 1,8 | 1,1 | 0,4 | 0 |
| UV Index | 7 | 6 | 4 | 3 | 2 | 1 | 2 | 3 | 4 | 6 | 7 | 7 |
Click on the month name to see more weather details, like daily averages, temperatures, and precipitation for the past years in that month.
- Average yearly temperature: 10°C
- Highest temperature: 14°C in January and February
- Lowest temperature: 5°C in July
- Precipitation*: 277 mm per year, averaging 23 mm per month
- Snowfall: 31 cm per year
- Driest months: 13 mm in September, 19 mm in January and October
- Wettest months: 33 mm in April, 29 mm in May and 28 mm in March
*Precipitation is measured as a combination of rain, snow, and hail
Weather experiences in Punta Arenas
Average Temperature per Month in Punta Arenas
This graph shows the average maximum temperatures per month in Punta Arenas, Chile. The temperatures are shown in degrees Celsius and the average is calculated based on the recorded temperatures per month from past years.
Average Precipitation per Month in Punta Arenas
This graph shows how much rainfall Punta Arenas, Chile, gets on average per month. Rainfall is always measured as water, even if it's snow or hail. This makes it easy to compare how much has fallen, regardless of the form of precipitation. The amount of rainfall is measured in millimeters, and the average is calculated based on the recorded rainfall per month from past years.
Average Snowfall per Month in Punta Arenas
This graph shows how much snow Punta Arenas, Chile, gets on average per month. The amount of snowfall is measured in centimeters and the average is calculated based on the recorded snowfall per month from past years.
Average UV Index per Month in Punta Arenas
This graph shows the average UV index per month in Punta Arenas, Chile. The UV index indicates the intensity of ultraviolet radiation and ranges from 0 to a maximum of 11.
Yearly Temperature in Punta Arenas
This graph shows the average yearly temperature in Punta Arenas, Chile. The yearly temperature, expressed in degrees Celsius, is the average of all twelve monthly temperatures summed up for that year.
Total Yearly Precipitation in Punta Arenas
This chart shows the total yearly precipitation in Punta Arenas, Chile, over the past few years. The total yearly precipitation, measured in millimeters, is the sum of all the rain that fell in the twelve months of that year.
Total Yearly Snowfall in Punta Arenas
This chart shows the total yearly snowfall in Punta Arenas, Chile, over the past few years. The total yearly snowfall, measured in centimeters, is the sum of all the snow that fell in the twelve months of that year.
Weather experiences in Punta Arenas
The weather in Punta Arenas is rated an average of 3,4 out of 5 stars by 8 visitors. Have you been to Punta Arenas? Share your weather experience to help other visitors.
Write your own reviewJune in Punta Arenas is incredibly cold and windy, but the snow-covered landscape made it spectacular and worth it. I recommend warm clothes!— This text is automatically translated to English
For outdoor activities, the pleasant cold was still within reach, but be sure to bring warm clothes!— This text is automatically translated to English
For winter lovers, this is an ideal place, but if you are looking for warmth and sun, this is not the best time to visit.— This text is automatically translated to English
The days were clear and mostly cool, around 15 degrees. Ideal weather conditions for active recreation with frequent high winds. However, the evenings became considerably colder.— This text is automatically translated to English
The humidity caused frequent fog and it was cold. However, there were bright, sunny days that compensated somewhat for the weather, but light clothing was not enough. Improvement point: temperature stabilization.— This text is automatically translated to English
It is definitely cold, so bring plenty of warm clothes. Expect short days but beautiful sunsets.— This text is automatically translated to English
Frequent rainfall makes it not ideal for outdoor activities, but the unique atmosphere more than makes up for this. Don't expect a sunny vacation.— This text is automatically translated to English
The weather was as calm,just like autumn in the Netherlands you could do without your winter coat with off and sun. For me it felt like late summer but in the evening it cooled down considerably.— This text is automatically translated to English
Have you been to Punta Arenas?
Share your weather experiences in Punta Arenas.
Average weather in Punta Arenas by month
Click on a month below to see detailed weather info for Punta Arenas. Based on historical weather data, you can see the average temperature, precipitation, wind, and UV index for each day of the month.
Popular destinations in Chile
Discover the climate of these popular destinations in Chile.