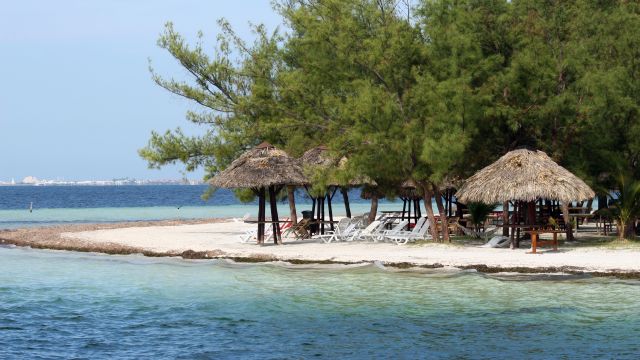
What’s the climate like in Mambo Beach?
The current climate in Mambo Beach features temperatures ranging from a high of 33°C to a low of 30°C throughout the year. The average yearly temperature is around 32°C. At night, temperatures in the colder months average around 24°C and in the warmer months around 27°C.
The highest temperature recorded in Mambo Beach in recent years was 37°C in September 2017. The lowest daytime temperature recorded was 25°C in March 2021.
On average, Mambo Beach receives 634 mm of precipitation each year. For comparison, New York gets 1142 mm of precipitation annually.
Curious about the weather in other parts of Curaçao? Check out the climate and weather for spots like Willemstad, Sint Willibrordus, Barber, or explore other destinations in Curaçao.
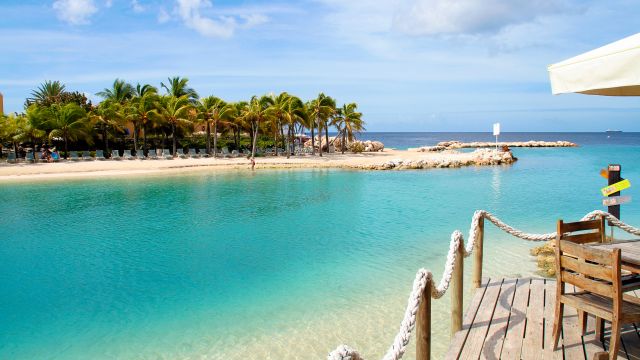
Best time to visit Mambo Beach?
The best time to visit Mambo Beach for sunny weather is January through October and December. During this period, you'll have nice temperatures and not too much rain, making it a great time to visit Mambo Beach. In the other months of the year, there's too much rain or the temperature isn't ideal for a visit if you want sunny and pleasant weather.
Climate Table of Mambo Beach
The climate table of Mambo Beach shows the average temperatures, rainfall, and UV index per month. The table provides an overview of the average day and night temperatures in degrees Celsius, the total amount of rainfall in millimeters, the total snowfall in centimeters, and the UV index for each month. Rainfall is always measured as water, even if it's snow or hail.
| Jan | Feb | Mar | Apr | May | Jun | Jul | Aug | Sep | Oct | Nov | Dec | |
|---|---|---|---|---|---|---|---|---|---|---|---|---|
| Temp. max (°C) | 30 | 30 | 30 | 31 | 31 | 32 | 32 | 33 | 33 | 32 | 31 | 30 |
| Temp. min (°C) | 25 | 25 | 25 | 26 | 26 | 27 | 27 | 28 | 28 | 27 | 26 | 26 |
| Precipitation | ||||||||||||
| Precipitation (mm) | 43 | 37 | 46 | 39 | 6,1 | 21 | 39 | 51 | 32 | 105 | 148 | 66 |
| UV Index | 8 | 9 | 9 | 9 | 9 | 9 | 9 | 9 | 9 | 8 | 8 | 8 |
Click on the month name to see more weather details, like daily averages, temperatures, and precipitation for the past years in that month.
- Average yearly temperature: 32°C
- Highest temperature: 33°C in August and September
- Lowest temperature: 30°C in January, February, March and December
- Precipitation: 634 mm per year, averaging 53 mm per month
- Driest months: 6,1 mm in May, 21 mm in June and 32 mm in September
- Wettest months: 148 mm in November, 105 mm in October and 66 mm in December
Weather experiences in Mambo Beach
Excellent![]()
![]()
![]()
![]()
![]()
The sky was beautifully blue and the temperature was around ... more
Excellent![]()
![]()
![]()
![]()
![]()
Not a cloud, perfect beach weather. The rare showers soon su... more
Table of Contents
Average Temperature per Month in Mambo Beach
This graph shows the average maximum temperatures per month in Mambo Beach, Curaçao. The temperatures are shown in degrees Celsius and the average is calculated based on the recorded temperatures per month from past years.
Average Precipitation per Month in Mambo Beach
This graph shows how much rainfall Mambo Beach, Curaçao, gets on average per month. Rainfall is always measured as water, even if it's snow or hail. This makes it easy to compare how much has fallen, regardless of the form of precipitation. The amount of rainfall is measured in millimeters, and the average is calculated based on the recorded rainfall per month from past years.
Average UV Index per Month in Mambo Beach
This graph shows the average UV index per month in Mambo Beach, Curaçao. The UV index indicates the intensity of ultraviolet radiation and ranges from 0 to a maximum of 11.
Yearly Temperature in Mambo Beach
This graph shows the average yearly temperature in Mambo Beach, Curaçao. The yearly temperature, expressed in degrees Celsius, is the average of all twelve monthly temperatures summed up for that year.
Total Yearly Precipitation in Mambo Beach
This chart shows the total yearly precipitation in Mambo Beach, Curaçao, over the past few years. The total yearly precipitation, measured in millimeters, is the sum of all the rain that fell in the twelve months of that year.
Weather experiences in Mambo Beach
The weather in Mambo Beach is rated an average of 4,6 out of 5 stars by 7 visitors. Have you been to Mambo Beach? Share your weather experience to help other visitors.
Write your own reviewThe sky was beautifully blue and the temperature was around 28 degrees. The heat was perfectly balanced by the cool trade winds. A true tropical delight!— This text is automatically translated to English
Not a cloud, perfect beach weather. The rare showers soon subsided and provided pleasant refreshment.— This text is automatically translated to English
The refreshing dives in the sea were a real pleasure. Rarely clouds in the sky.— This text is automatically translated to English
Due to the high temperatures, Mambo Beach can sometimes get a little too hot, but most of the time it was perfect.— This text is automatically translated to English
A few brief showers kept the air cool at times, but overall it was dry and there were regular sunny days.— This text is automatically translated to English
Although a bit hot at times, the heat was bearable in the shade. A rare early morning shower was somewhat refreshing. Highly recommended for beach lovers!— This text is automatically translated to English
It was sunny almost every day except for an occasional thunderstorm. Because of the heat, we had to swim early and drink a lot of water.— This text is automatically translated to English
Have you been to Mambo Beach?
Share your weather experiences in Mambo Beach.
Average weather in Mambo Beach by month
Click on a month below to see detailed weather info for Mambo Beach. Based on historical weather data, you can see the average temperature, precipitation, wind, and UV index for each day of the month.
Popular destinations in Curaçao
Discover the climate of these popular destinations in Curaçao.