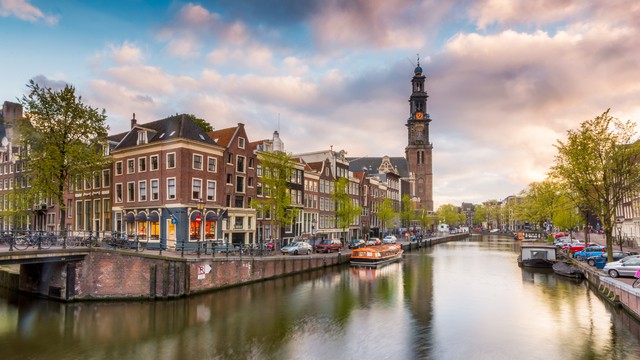
What’s the climate like in Amsterdam?
The current climate in Amsterdam features temperatures ranging from a high of 23°C to a low of 7°C throughout the year. The average yearly temperature is around 16°C. At night, temperatures in the colder months average around 2°C and in the warmer months around 14°C.
The highest temperature recorded in Amsterdam in recent years was 37°C in July 2019. The lowest daytime temperature recorded was -5°C in February 2018.
On average, Amsterdam gets 839 mm of precipitation each year. Of this, about 4,8 cm is snowfall. For comparison, New York gets 1142 mm of precipitation each year.
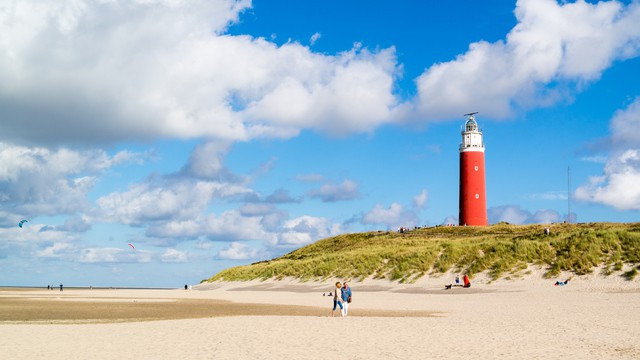
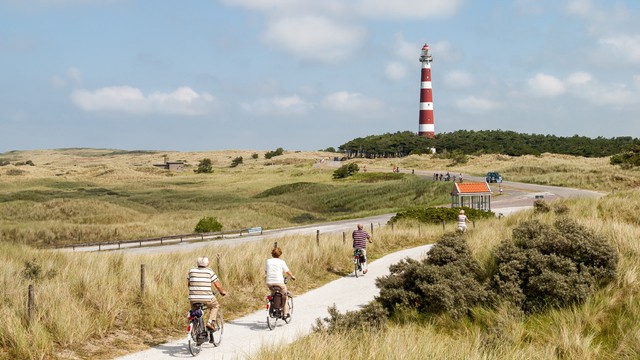
Curious about the weather in other parts of Netherlands? Check out the climate and weather for spots like Texel, Veluwe, Zeeland, or explore other destinations in Netherlands.
Best time to visit Amsterdam?
The best time to visit Amsterdam for sunny weather is May through September. During this period, you'll have nice temperatures and not too much rain, making it a great time to visit Amsterdam. In the other months of the year, there's too much rain or the temperature isn't ideal for a visit if you want sunny and pleasant weather.
Climate Table of Amsterdam
The climate table of Amsterdam shows the average temperatures, rainfall, snow, and UV index per month. The table provides an overview of the average day and night temperatures in degrees Celsius, the total amount of rainfall in millimeters, the total snowfall in centimeters, and the UV index for each month. Rainfall is always measured as water, even if it's snow or hail.
Click on the month name to see more weather details, like daily averages, temperatures, and precipitation for the past years in that month.
- Average yearly temperature: 16°C
- Highest temperature: 23°C in July and August
- Lowest temperature: 7°C in January
- Precipitation*: 839 mm per year, averaging 70 mm per month
- Snowfall: 4,8 cm per year
- Driest months: 42 mm in April, 43 mm in May and 59 mm in June
- Wettest months: 89 mm in August, 85 mm in November and 84 mm in January
*Precipitation is measured as a combination of rain, snow, and hail
Average Temperature per Month in Amsterdam
This graph shows the average maximum temperatures per month in Amsterdam, Netherlands. The temperatures are shown in degrees Celsius and the average is calculated based on the recorded temperatures per month from past years.
Average Precipitation per Month in Amsterdam
This graph shows how much rainfall Amsterdam, Netherlands, gets on average per month. Rainfall is always measured as water, even if it's snow or hail. This makes it easy to compare how much has fallen, regardless of the form of precipitation. The amount of rainfall is measured in millimeters, and the average is calculated based on the recorded rainfall per month from past years.
Average Snowfall per Month in Amsterdam
This graph shows how much snow Amsterdam, Netherlands, gets on average per month. The amount of snowfall is measured in centimeters and the average is calculated based on the recorded snowfall per month from past years.
Average UV Index per Month in Amsterdam
This graph shows the average UV index per month in Amsterdam, Netherlands. The UV index indicates the intensity of ultraviolet radiation and ranges from 0 to a maximum of 11.
Yearly Temperature in Amsterdam
This graph shows the average yearly temperature in Amsterdam, Netherlands. The yearly temperature, expressed in degrees Celsius, is the average of all twelve monthly temperatures summed up for that year.
Total Yearly Precipitation in Amsterdam
This chart shows the total yearly precipitation in Amsterdam, Netherlands, over the past few years. The total yearly precipitation, measured in millimeters, is the sum of all the rain that fell in the twelve months of that year.
Total Yearly Snowfall in Amsterdam
This chart shows the total yearly snowfall in Amsterdam, Netherlands, over the past few years. The total yearly snowfall, measured in centimeters, is the sum of all the snow that fell in the twelve months of that year.
More Climate Info About Amsterdam
Amsterdam has a maritime climate, which means the weather is influenced by its proximity to the sea throughout the year. This ensures mild temperatures and precipitation throughout all seasons.
Amsterdam's climate is characterized by rainfall in all months of the year. With an average annual temperature of 13 degrees Celsius and precipitation of 435 mm per year, the city is a true watery place. About 143 days a year are dry, but the average humidity remains high at 81%. The UV index hovers around 3.
Lente
A spring in Amsterdam brings a pleasant mix of mild temperatures and refreshing rain. With flowers blooming along the canals and temperatures fluctuating between 5 and 15 degrees Celsius, the city comes alive.
Summer
Summer in Amsterdam is hot, but not stifling. July, the hottest month, is characterized by average temperatures of about 21 degrees Celsius. It is a perfect time to explore the parks and stroll along the waterways.
Autumn
.
As autumn makes its appearance in Amsterdam, it brings with it cool breezes and a symphony of colors. Temperatures drop to an average of 10 degrees Celsius, and rain showers become more frequent. It is a picturesque season when the city transforms into a living painting.
Winter
Amsterdam in winter is enchanting, with an average temperature of 5 degrees Celsius in January, the coldest month. Snowfall is not unusual, averaging 11 days a year. While the canals freeze, the city exudes a cozy atmosphere with its illuminated streets and warm cafes.
Weather experiences in Amsterdam
The weather in Amsterdam is rated an average of 0 out of 5 stars by 4 visitors. Have you been to Amsterdam? Share your weather experience to help other visitors.
Have you been to Amsterdam?
Share your weather experiences in Amsterdam.
Average weather in Amsterdam by month
Click on a month below to see detailed weather info for Amsterdam. Based on historical weather data, you can see the average temperature, precipitation, wind, and UV index for each day of the month.
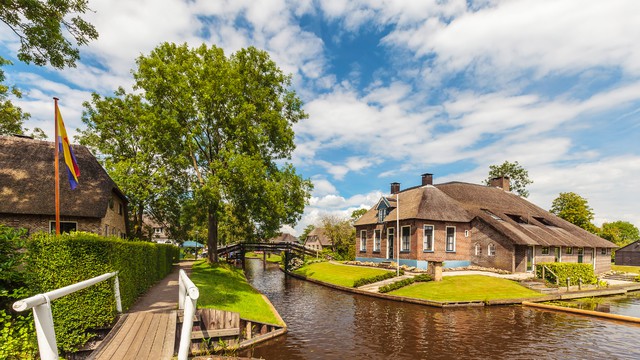
Popular destinations in Netherlands
Discover the climate of these popular destinations in Netherlands.