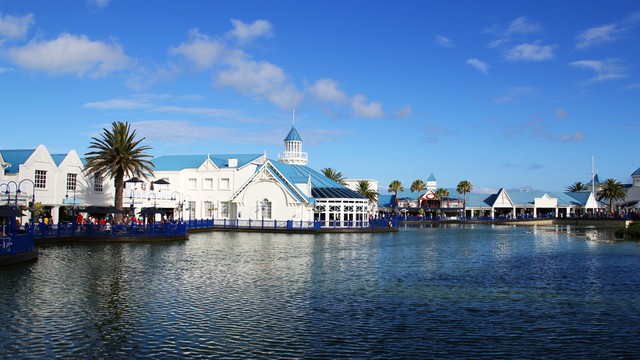
What’s the climate like in Port Elizabeth?
The current climate in Port Elizabeth features temperatures ranging from a high of 26°C to a low of 21°C throughout the year. The average yearly temperature is around 24°C. At night, temperatures in the colder months average around 9°C and in the warmer months around 18°C.
The highest temperature recorded in Port Elizabeth in recent years was 41°C in February 2020. The lowest daytime temperature recorded was 10°C in July 2021.
On average, Port Elizabeth receives 598 mm of precipitation each year. For comparison, New York gets 1142 mm of precipitation annually.
Curious about the weather in other parts of South Africa? Check out the climate and weather for spots like Cape Town, Krugerpark, Johannesburg, or explore other destinations in South Africa.
Best time to visit Port Elizabeth?
The best time to visit Port Elizabeth for sunny weather is January through December. During this period, you'll have nice temperatures and not too much rain, making it a great time to visit Port Elizabeth.
Climate Table of Port Elizabeth
The climate table of Port Elizabeth shows the average temperatures, rainfall, and UV index per month. The table provides an overview of the average day and night temperatures in degrees Celsius, the total amount of rainfall in millimeters, the total snowfall in centimeters, and the UV index for each month. Rainfall is always measured as water, even if it's snow or hail.
| Jan | Feb | Mar | Apr | May | Jun | Jul | Aug | Sep | Oct | Nov | Dec | |
|---|---|---|---|---|---|---|---|---|---|---|---|---|
| Temp. max (°C) | 26 | 26 | 25 | 23 | 23 | 22 | 21 | 21 | 21 | 22 | 23 | 25 |
| Temp. min (°C) | 19 | 18 | 17 | 15 | 12 | 10 | 9 | 10 | 12 | 14 | 15 | 17 |
| Precipitation | ||||||||||||
| Precipitation (mm) | 20 | 55 | 45 | 50 | 53 | 44 | 68 | 73 | 55 | 46 | 49 | 40 |
| UV Index | 9 | 8 | 8 | 6 | 5 | 4 | 5 | 6 | 7 | 8 | 9 | 9 |
Click on the month name to see more weather details, like daily averages, temperatures, and precipitation for the past years in that month.
- Average yearly temperature: 24°C
- Highest temperature: 26°C in January and February
- Lowest temperature: 21°C in July, August and September
- Precipitation: 598 mm per year, averaging 50 mm per month
- Driest months: 20 mm in January, 40 mm in December and 44 mm in June
- Wettest months: 73 mm in August, 68 mm in July and 55 mm in February
Weather experiences in Port Elizabeth
Good![]()
![]()
![]()
![]()
Mostly sunny, with a pleasant temperature of around 27 degre... more
Good![]()
![]()
![]()
![]()
Clear, sunny days, a few cool evenings and occasional rain. ... more
Table of Contents
Average Temperature per Month in Port Elizabeth
This graph shows the average maximum temperatures per month in Port Elizabeth, South Africa. The temperatures are shown in degrees Celsius and the average is calculated based on the recorded temperatures per month from past years.
Average Precipitation per Month in Port Elizabeth
This graph shows how much rainfall Port Elizabeth, South Africa, gets on average per month. Rainfall is always measured as water, even if it's snow or hail. This makes it easy to compare how much has fallen, regardless of the form of precipitation. The amount of rainfall is measured in millimeters, and the average is calculated based on the recorded rainfall per month from past years.
Average UV Index per Month in Port Elizabeth
This graph shows the average UV index per month in Port Elizabeth, South Africa. The UV index indicates the intensity of ultraviolet radiation and ranges from 0 to a maximum of 11.
Yearly Temperature in Port Elizabeth
This graph shows the average yearly temperature in Port Elizabeth, South Africa. The yearly temperature, expressed in degrees Celsius, is the average of all twelve monthly temperatures summed up for that year.
Total Yearly Precipitation in Port Elizabeth
This chart shows the total yearly precipitation in Port Elizabeth, South Africa, over the past few years. The total yearly precipitation, measured in millimeters, is the sum of all the rain that fell in the twelve months of that year.
Weather experiences in Port Elizabeth
The weather in Port Elizabeth is rated an average of 4 out of 5 stars by 5 visitors. Have you been to Port Elizabeth? Share your weather experience to help other visitors.
Write your own reviewMostly sunny, with a pleasant temperature of around 27 degrees Celsius, ideal for outdoor activities. It rained several days, but that did not really hamper the vacation.— This text is automatically translated to English
Clear, sunny days, a few cool evenings and occasional rain. Don't expect tropical weather, but plenty of warmth in the winter months. Ideal for active vacations.— This text is automatically translated to English
The days were ideal for active relaxation and the evenings were pleasantly cool. A true paradise for lovers of temperate climates. The winds can be a bit strong at times.— This text is automatically translated to English
The days were warm, but not unbearably hot, with plenty of sunshine and reasonably clear skies. The evenings were cooler, which was ideal for evening safaris. A few showers but nothing that ruined the overall experience.— This text is automatically translated to English
Evenings were cool and comfortable. There was very little precipitation, only short showers. In short, almost perfect!— This text is automatically translated to English
Have you been to Port Elizabeth?
Share your weather experiences in Port Elizabeth.
Average weather in Port Elizabeth by month
Click on a month below to see detailed weather info for Port Elizabeth. Based on historical weather data, you can see the average temperature, precipitation, wind, and UV index for each day of the month.
Popular destinations in South Africa
Discover the climate of these popular destinations in South Africa.