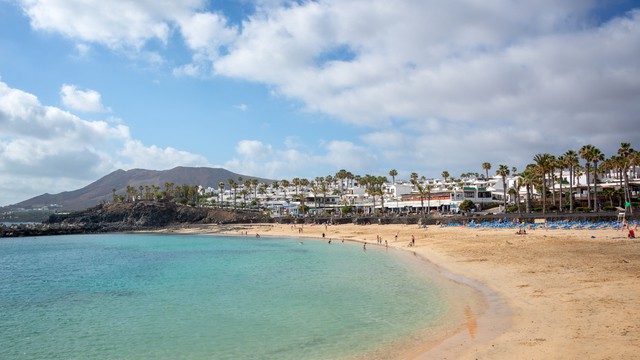
What’s the climate like in Playa Blanca?
The current climate in Playa Blanca features temperatures ranging from a high of 30°C to a low of 21°C throughout the year. The average yearly temperature is around 26°C. At night, temperatures in the colder months average around 14°C and in the warmer months around 22°C.
The highest temperature recorded in Playa Blanca in recent years was 40°C in August 2021. The lowest daytime temperature recorded was 15°C in January 2018.
On average, Playa Blanca receives 97 mm of precipitation each year. For comparison, New York gets 1142 mm of precipitation annually.
Best time to visit Playa Blanca?
The best time to visit Playa Blanca for sunny weather is January through December. During this period, you'll have nice temperatures and not too much rain, making it a great time to visit Playa Blanca.
Climate Table of Playa Blanca
The climate table of Playa Blanca shows the average temperatures, rainfall, and UV index per month. The table provides an overview of the average day and night temperatures in degrees Celsius, the total amount of rainfall in millimeters, the total snowfall in centimeters, and the UV index for each month. Rainfall is always measured as water, even if it's snow or hail.
| Jan | Feb | Mar | Apr | May | Jun | Jul | Aug | Sep | Oct | Nov | Dec | |
|---|---|---|---|---|---|---|---|---|---|---|---|---|
| Temp. max (°C) | 21 | 22 | 23 | 24 | 25 | 27 | 29 | 30 | 29 | 27 | 25 | 22 |
| Temp. min (°C) | 15 | 15 | 16 | 17 | 19 | 20 | 22 | 23 | 22 | 21 | 18 | 17 |
| Precipitation | ||||||||||||
| Precipitation (mm) | 11 | 19 | 7,9 | 3,8 | 0,9 | 0,3 | 0,5 | 1,2 | 0,6 | 11 | 36 | 4,8 |
| UV Index | 6 | 7 | 8 | 9 | 9 | 9 | 9 | 9 | 8 | 7 | 6 | 6 |
Click on the month name to see more weather details, like daily averages, temperatures, and precipitation for the past years in that month.
Weather experiences in Playa Blanca
Good![]()
![]()
![]()
![]()
It was a bit windy and cloudy for a day or two, but that did... more
Good![]()
![]()
![]()
![]()
Although there were cloudy days with occasional rain, it was... more
Table of Contents
Average Temperature per Month in Playa Blanca
This graph shows the average maximum temperatures per month in Playa Blanca, Lanzarote. The temperatures are shown in degrees Celsius and the average is calculated based on the recorded temperatures per month from past years.
Average Precipitation per Month in Playa Blanca
This graph shows how much rainfall Playa Blanca, Lanzarote, gets on average per month. Rainfall is always measured as water, even if it's snow or hail. This makes it easy to compare how much has fallen, regardless of the form of precipitation. The amount of rainfall is measured in millimeters, and the average is calculated based on the recorded rainfall per month from past years.
Average UV Index per Month in Playa Blanca
This graph shows the average UV index per month in Playa Blanca, Lanzarote. The UV index indicates the intensity of ultraviolet radiation and ranges from 0 to a maximum of 11.
Yearly Temperature in Playa Blanca
This graph shows the average yearly temperature in Playa Blanca, Lanzarote. The yearly temperature, expressed in degrees Celsius, is the average of all twelve monthly temperatures summed up for that year.
Total Yearly Precipitation in Playa Blanca
This chart shows the total yearly precipitation in Playa Blanca, Lanzarote, over the past few years. The total yearly precipitation, measured in millimeters, is the sum of all the rain that fell in the twelve months of that year.
Weather experiences in Playa Blanca
The weather in Playa Blanca is rated an average of 3,8 out of 5 stars by 5 visitors. Have you been to Playa Blanca? Share your weather experience to help other visitors.
Write your own reviewThe walking was pleasant, although the water was still too cold for swimming. For the evening, warm clothing is mandatory.— This text is automatically translated to English
It was a bit windy and cloudy for a day or two, but that didn't bother us. Ideal for a relaxing vacation.— This text is automatically translated to English
Although there were cloudy days with occasional rain, it was mostly sunny. The atmosphere was relaxed and calm.— This text is automatically translated to English
No overwhelming heat, but warm and sunny, around 24 degrees. The occasional rain shower could not ruin the great experience.— This text is automatically translated to English
In December, Playa Blanca in Lanzarote had beautiful sunny weather with moderate temperatures suitable for an active vacation. It rained off and on. Overall satisfied.— This text is automatically translated to English
Have you been to Playa Blanca?
Share your weather experiences in Playa Blanca.
Average weather in Playa Blanca by month
Click on a month below to see detailed weather info for Playa Blanca. Based on historical weather data, you can see the average temperature, precipitation, wind, and UV index for each day of the month.