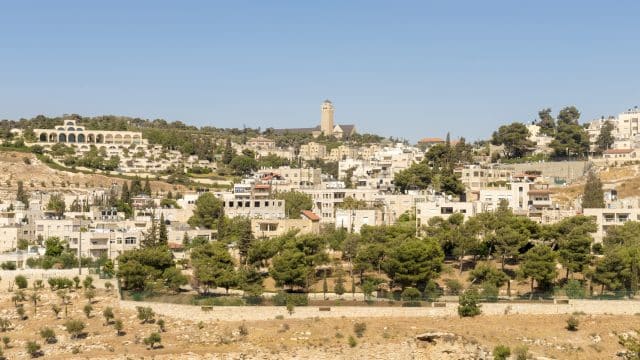
What’s the climate like in Palestine?
The current climate in Palestine features temperatures ranging from a high of 33°C to a low of 18°C throughout the year. The average yearly temperature is around 26°C. At night, temperatures in the colder months average around 8°C and in the warmer months around 23°C.
The highest temperature recorded in Palestine in recent years was 44°C in May 2019. The lowest daytime temperature recorded was 6°C in February 2021.
On average, Palestine receives 507 mm of precipitation each year. For comparison, New York gets 1142 mm of precipitation annually.
Best time to visit Palestine?
The best time to visit Palestine for sunny weather is February through December. During this period, you'll have nice temperatures and not too much rain, making it a great time to visit Palestine. In the other months of the year, there's too much rain or the temperature isn't ideal for a visit if you want sunny and pleasant weather.
Climate Table of Palestine
The climate table of Palestine shows the average temperatures, rainfall, and UV index per month. The table provides an overview of the average day and night temperatures in degrees Celsius, the total amount of rainfall in millimeters, the total snowfall in centimeters, and the UV index for each month. Rainfall is always measured as water, even if it's snow or hail.
| Jan | Feb | Mar | Apr | May | Jun | Jul | Aug | Sep | Oct | Nov | Dec | |
|---|---|---|---|---|---|---|---|---|---|---|---|---|
| Temp. max (°C) | 18 | 19 | 21 | 25 | 29 | 30 | 32 | 33 | 32 | 29 | 24 | 20 |
| Temp. min (°C) | 8 | 9 | 11 | 14 | 18 | 21 | 23 | 24 | 22 | 19 | 15 | 11 |
| Precipitation | - | - | ||||||||||
| Precipitation (mm) | 135 | 111 | 58 | 24 | 3,8 | 0,5 | 0 | 0 | 0,9 | 12 | 57 | 104 |
| UV Index | 5 | 6 | 8 | 9 | 9 | 10 | 10 | 9 | 9 | 7 | 6 | 5 |
Click on the month name to see more weather details, like daily averages, temperatures, and precipitation for the past years in that month.
Weather experiences in Palestine
Good![]()
![]()
![]()
![]()
Although it rained on some days, it was generally moderate a... more
Good![]()
![]()
![]()
![]()
The October weather in Palestine was pleasant: warm days wit... more
Table of Contents
Average Temperature per Month in Palestine
This graph shows the average maximum temperatures per month in Palestine. The temperatures are shown in degrees Celsius and the average is calculated based on the recorded temperatures per month from past years.
Average Precipitation per Month in Palestine
This graph shows how much rainfall Palestine gets on average per month. Rainfall is always measured as water, even if it's snow or hail. This makes it easy to compare how much has fallen, regardless of the form of precipitation. The amount of rainfall is measured in millimeters, and the average is calculated based on the recorded rainfall per month from past years.
Average UV Index per Month in Palestine
This graph shows the average UV index per month in Palestine. The UV index indicates the intensity of ultraviolet radiation and ranges from 0 to a maximum of 11.
Yearly Temperature in Palestine
This graph shows the average yearly temperature in Palestine. The yearly temperature, expressed in degrees Celsius, is the average of all twelve monthly temperatures summed up for that year.
Total Yearly Precipitation in Palestine
This chart shows the total yearly precipitation in Palestine over the past few years. The total yearly precipitation, measured in millimeters, is the sum of all the rain that fell in the twelve months of that year.
Weather experiences in Palestine
The weather in Palestine is rated an average of 3,7 out of 5 stars by 3 visitors. Have you been to Palestine? Share your weather experience to help other visitors.
Write your own reviewAlthough it rained on some days, it was generally moderate and refreshing. The sun shone pleasantly warm throughout the day.— This text is automatically translated to English
The October weather in Palestine was pleasant: warm days with a pleasant coolness in the evenings. Although there were a few showers, they were short-lived and helped refresh the landscape. A pleasant surprise for the autumn vacations!— This text is automatically translated to English
Temperatures are pleasant in the early morning and evening, but become extremely uncomfortable in the heat of the afternoon. Small umbrella available. Really dry heat.— This text is automatically translated to English
Have you been to Palestine?
Share your weather experiences in Palestine.
Average weather in Palestine by month
Click on a month below to see detailed weather info for Palestine. Based on historical weather data, you can see the average temperature, precipitation, wind, and UV index for each day of the month.