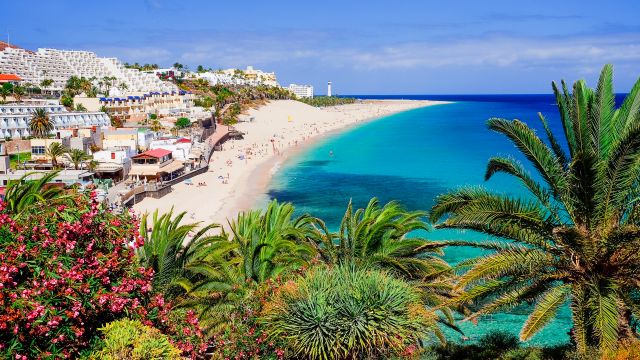
What’s the climate like in Tarifa?
The current climate in Tarifa features temperatures ranging from a high of 30°C to a low of 17°C throughout the year. The average yearly temperature is around 23°C. At night, temperatures in the colder months average around 11°C and in the warmer months around 21°C.
The highest temperature recorded in Tarifa in recent years was 42°C in August 2023. The lowest daytime temperature recorded was 8°C in January 2021.
On average, Tarifa receives 613 mm of precipitation each year. For comparison, New York gets 1142 mm of precipitation annually.
Curious about the weather in other parts of Spain? Check out the climate and weather for spots like Ibiza, Majorca, Tenerife, or explore other destinations in Spain.
Best time to visit Tarifa?
The best time to visit Tarifa for sunny weather is March through December. During this period, you'll have nice temperatures and not too much rain, making it a great time to visit Tarifa. In the other months of the year, there's too much rain or the temperature isn't ideal for a visit if you want sunny and pleasant weather.
Climate Table of Tarifa
The climate table of Tarifa shows the average temperatures, rainfall, and UV index per month. The table provides an overview of the average day and night temperatures in degrees Celsius, the total amount of rainfall in millimeters, the total snowfall in centimeters, and the UV index for each month. Rainfall is always measured as water, even if it's snow or hail.
| Jan | Feb | Mar | Apr | May | Jun | Jul | Aug | Sep | Oct | Nov | Dec | |
|---|---|---|---|---|---|---|---|---|---|---|---|---|
| Temp. max (°C) | 17 | 17 | 19 | 20 | 24 | 26 | 29 | 30 | 27 | 24 | 20 | 18 |
| Temp. min (°C) | 11 | 12 | 12 | 15 | 17 | 19 | 22 | 22 | 21 | 18 | 14 | 12 |
| Precipitation | ||||||||||||
| Precipitation (mm) | 78 | 70 | 110 | 56 | 23 | 7,1 | 0,6 | 0,8 | 10 | 54 | 101 | 102 |
| UV Index | 5 | 6 | 8 | 8 | 9 | 9 | 9 | 9 | 7 | 5 | 5 | 5 |
Click on the month name to see more weather details, like daily averages, temperatures, and precipitation for the past years in that month.
- Average yearly temperature: 23°C
- Highest temperature: 30°C in August
- Lowest temperature: 17°C in January and February
- Precipitation: 613 mm per year, averaging 51 mm per month
- Driest months: 0,6 mm in July, 0,8 mm in August and 7,1 mm in June
- Wettest months: 110 mm in March, 102 mm in December and 101 mm in November
Weather experiences in Tarifa
Good![]()
![]()
![]()
![]()
Temperatures often reached 30 degrees, ideal for a sunny vac... more
Good![]()
![]()
![]()
![]()
During the day the sun shone, but towards evening it got sig... more
Table of Contents
Average Temperature per Month in Tarifa
This graph shows the average maximum temperatures per month in Tarifa, Spain. The temperatures are shown in degrees Celsius and the average is calculated based on the recorded temperatures per month from past years.
Average Precipitation per Month in Tarifa
This graph shows how much rainfall Tarifa, Spain, gets on average per month. Rainfall is always measured as water, even if it's snow or hail. This makes it easy to compare how much has fallen, regardless of the form of precipitation. The amount of rainfall is measured in millimeters, and the average is calculated based on the recorded rainfall per month from past years.
Average UV Index per Month in Tarifa
This graph shows the average UV index per month in Tarifa, Spain. The UV index indicates the intensity of ultraviolet radiation and ranges from 0 to a maximum of 11.
Yearly Temperature in Tarifa
This graph shows the average yearly temperature in Tarifa, Spain. The yearly temperature, expressed in degrees Celsius, is the average of all twelve monthly temperatures summed up for that year.
Total Yearly Precipitation in Tarifa
This chart shows the total yearly precipitation in Tarifa, Spain, over the past few years. The total yearly precipitation, measured in millimeters, is the sum of all the rain that fell in the twelve months of that year.
Weather experiences in Tarifa
The weather in Tarifa is rated an average of 3,7 out of 5 stars by 12 visitors. Have you been to Tarifa? Share your weather experience to help other visitors.
Write your own reviewTemperatures often reached 30 degrees, ideal for a sunny vacation. Fortunately, the wind cooled off, even though it was constantly hot. Highly recommended for sun worshippers!— This text is automatically translated to English
During the day the sun shone, but towards evening it got significantly colder. There was a brisk wind, perfect for windsurfers!— This text is automatically translated to English
Hot sunny days were replaced by rare cool breezes. Ideal for relaxing by the pool or for outdoor activities.— This text is automatically translated to English
A good mix of sun and clouds with temperatures around 20 degrees, ideal for beach days and walks. However, there were a few windy days.— This text is automatically translated to English
During the day it was relatively warm, with some days of wind and rain. Nights were cool, but not too cold. Nice weather!— This text is automatically translated to English
September in Tarifa was great. Every day was sunny and warm, perfect for the beach. The evenings were pleasantly cool. However, there were also windy days, ideal for windsurfing, but not for relaxing.— This text is automatically translated to English
Although there are occasional strong winds, it is mostly sunny and pleasant. It is rarely cold, but occasional rain can be expected. Not perfect, but certainly not bad.— This text is automatically translated to English
Sometimes the wind is quite strong, which certainly makes it interesting for water sports enthusiasts. A pleasant vacation destination in June!— This text is automatically translated to English
Some days were very bright and sunny, with a pleasant temperature of around 24 degrees. But there were also days with unexpected rain and strong winds, making it uncomfortable to be outside.— This text is automatically translated to English
On some days it was very sunny, ideal for a walk on the beach. But occasionally it rained and was quite windy. The temperature was pleasant.— This text is automatically translated to English
Precipitation is sporadic, but occurs occasionally. An ideal climate for outdoor adventures, perhaps less so for beach lovers.— This text is automatically translated to English
April in Tarifa proved to be a subdued and charming month with a mild climate. The air temperature was about 20 degrees, which is ideal for a spring walk. We had a little wind which made it ideal for kitesurfing, but the sun made it easy to take it out.— This text is automatically translated to English
Have you been to Tarifa?
Share your weather experiences in Tarifa.
Average weather in Tarifa by month
Click on a month below to see detailed weather info for Tarifa. Based on historical weather data, you can see the average temperature, precipitation, wind, and UV index for each day of the month.
Popular destinations in Spain
Discover the climate of these popular destinations in Spain.